Dashboard
In Sirio’s dashboard, in the foreground, you can see the anomalies identified within the site, obtained and lost revenue. The revenue obtained is calculated on the basis of the products purchased online while the lost revenue on the basis of the anomalies found within e-commerce.
Sirio’s dashboard offers different graphs.
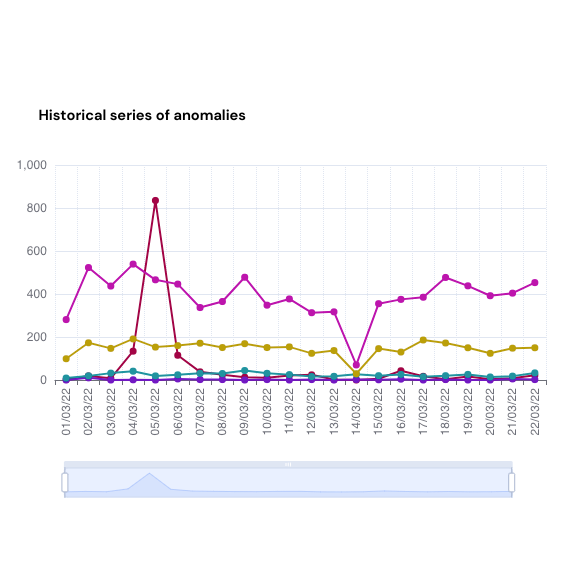
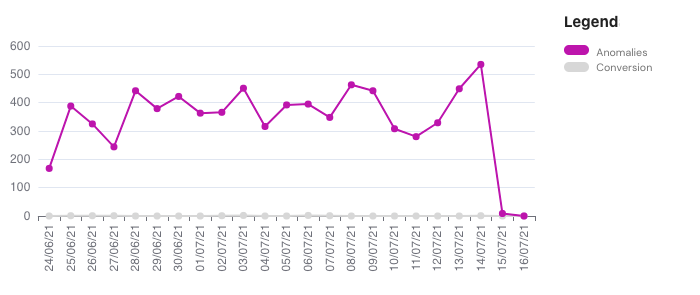
HISTORICAL SERIES OF ANOMALIES
It represents the trend of all the different anomalies that have been perceived in a given period. These can be:
- Javascript errors: JavaScript® is a coding language made up of a rigid set of mathematical rules, also known as syntax, which is expressed in the form of source code. When the JavaScript® syntax is incorrect, a JavaScript® error is returned and the application fails.
- Slow Pages: A page that exceeds the limit value set by Google.
- Pages not loaded (404): when the program cannot find or load the web page.
- Downsite (404) – Occurs when users are unable to access the website.
- Searches without result: occurs when a user enters a keyword in the search bar and there are no products on the results page.
- Bounce: consists of counting pages without interaction, without clicks.
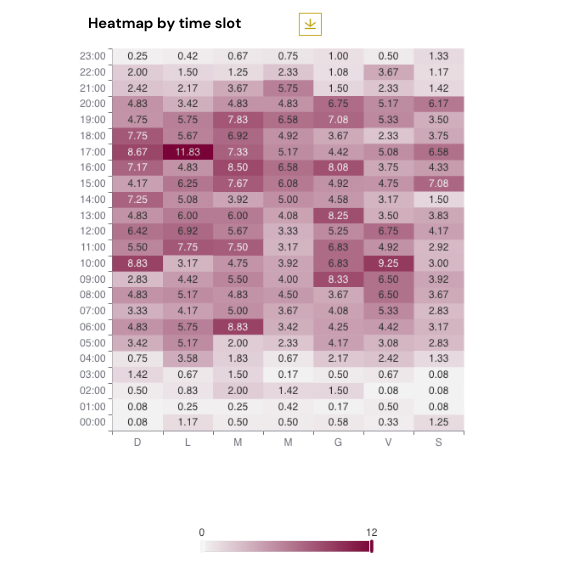
HEATMAP ANOMALIES BY TIME SLOT
The Heatmap uses colors to show the quantity of anomalies present every day in all time slots in a two-dimensional graph. The more intense the color is, the more anomalies have occurred.
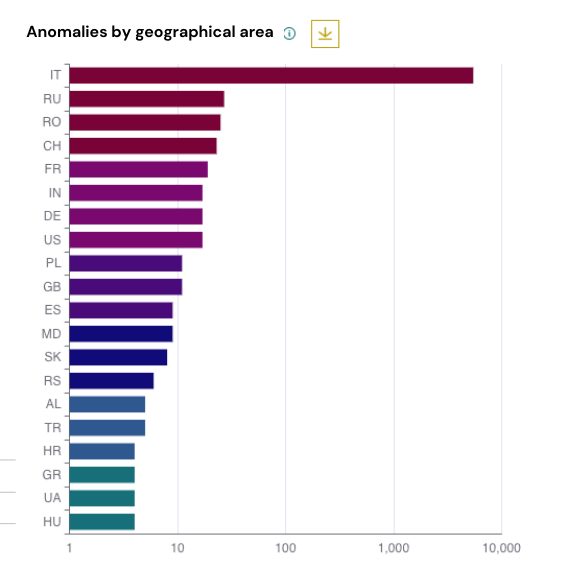
ANOMALIES BY GEOGRAPHICAL AREA
The graph illustrates the percentage of anomalies that occurred in the different geographical areas
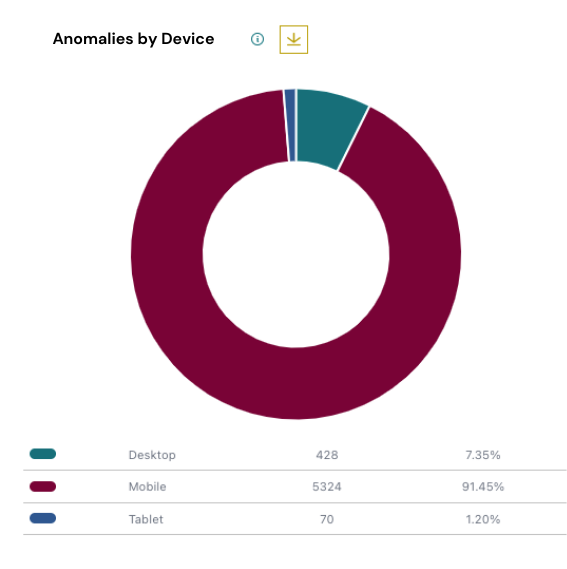
ANOMALIES BY DEVICE
The graph illustrates the% of anomalies occurred for each device.
HISTORICAL SERIES OF ANOMALIES AND CONVERSION
The graph shows the occurrence between anomalies and conversions in the same period.
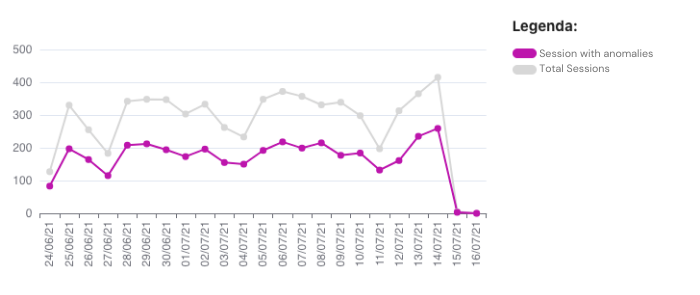
TIME SERIES TOTAL SESSION AND SESSION WITH ANOMALIES
The graph shows the duration between the sessions with anomalies and the total sessions that occurred in the same period.
Filters
In Sirio’s Dashboard it is possible to choose from a wide range of filters in order to make more accurate and specific searches according to every need.
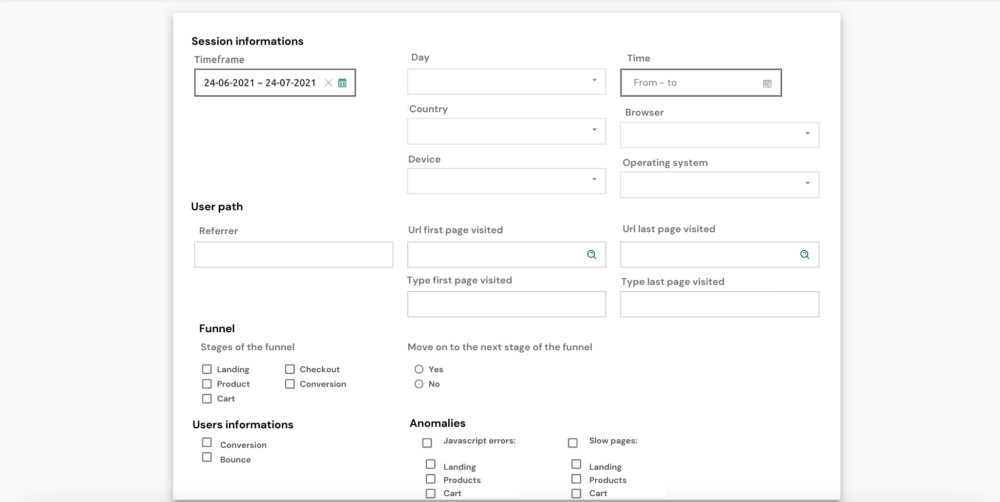
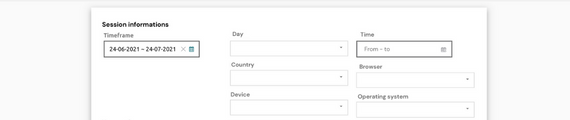
SESSION INFORMATION
- Time frame: fixed periods are available or it is possible to create a customized period with a start date and an end date
- Days: You can select one or more days
- Times: an internal day or a specific time slot
- Country: one or more countries
- Device: one or more devices
- Browser
- Operating system
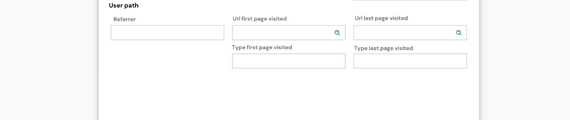
USER PATH
You can select the referral, the URL of the first and last page visited and its type.
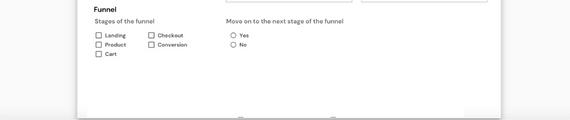
FUNNEL
You can select the single phase of the funnel that interests you most or all of them and the relative passage to the next phase
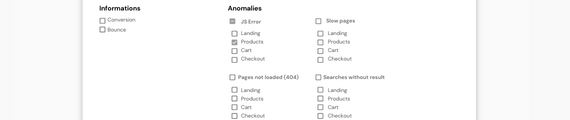
USER INFORMATION AND ANOMALIES
User activity and anomalies can be selected. Of these, you can select the Javascript error of interest.
TECHNOLOGICAL ANOMALIES
In the section “technological anomalies” you can find all the anomalies found on the site with the relative percentage and table.
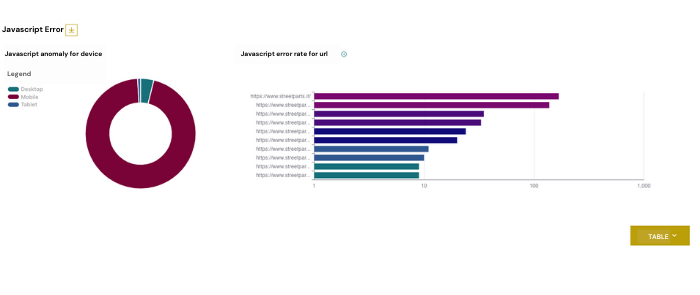
JAVASCRIPT ERRORS
- JS anomaly by device: the graph represents the percentage of JS errors for mobile device, tablet and desktop
- Javascript error rate by URL: the graph illustrates the% of JS errors in the various pages of the site, giving an idea of the pages with the most errors.
A table with the error message, page type and frequency is also provided below.
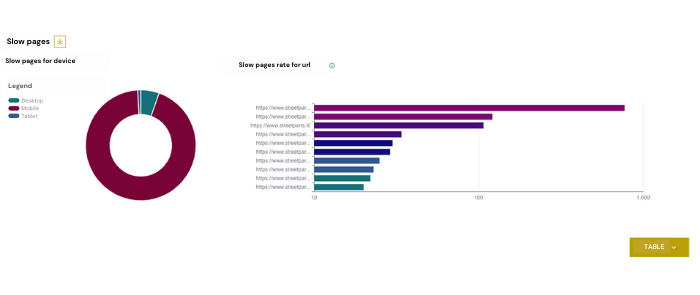
SLOW PAGES
- Slow pages by device: The graph illustrates the slowest device.
- Slow page rate per URL: The graph presents the% of slow pages.
A table with the speed index, frequency, relative frequency and type of page is also provided below.
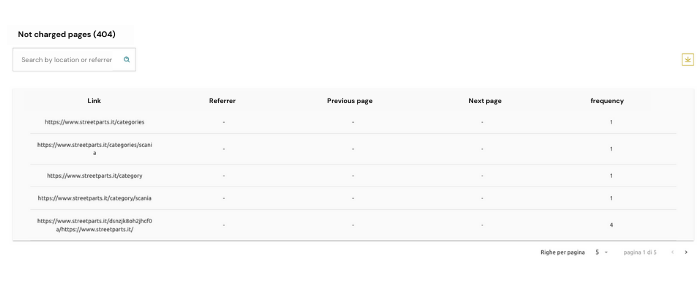
PAGES NOT LOADED
The table provides the link, the referral, the previous page, the button clicked and the frequency.
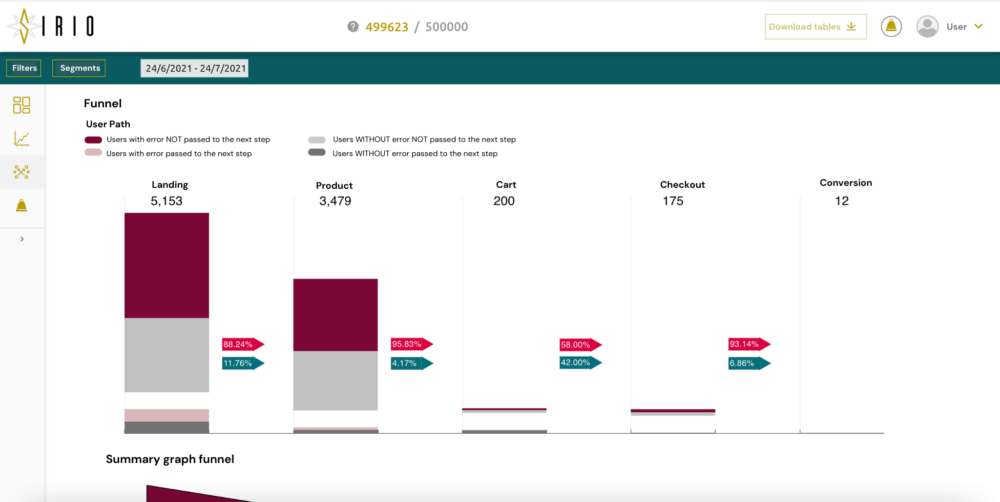
USER BEHAVIOUR
The section of user behaviour illustrates the funnel with the path of users who are divided into:
-
Users with error NOT moved on to the next stage: that is, users who have found an error and have exited the page
-
Error users who went to the next stage: that is, users who found an error but continued the path
-
Users WITHOUT error NOT passed to the next stage:that is users who have not found an error but have exited the page
-
ERROR-FREE users passed to the next stage: that is, users who did not find errors and continued their journey.
The phases are divided into Landing, Product, Cart, Checkout and Conversion.
BOUNCE RATE
Historical series of total sessions and bounce sessions: The graph compares daily sessions and daily bounces also providing percentages such as the Bounce Rate, the% of Bounce Rate that has encountered an anomaly and the% of Bounce Rate without anomaly.
RESEARCH ANALYSIS
Comparison of searches with and without results.
The graph illustrates the searches that gave results, that did not give results, unrelated, momentarily without result and with typo.
Finally there is a table with the search, the total quantity, the% of the search rate with result and% of the search quantity on the sessions.
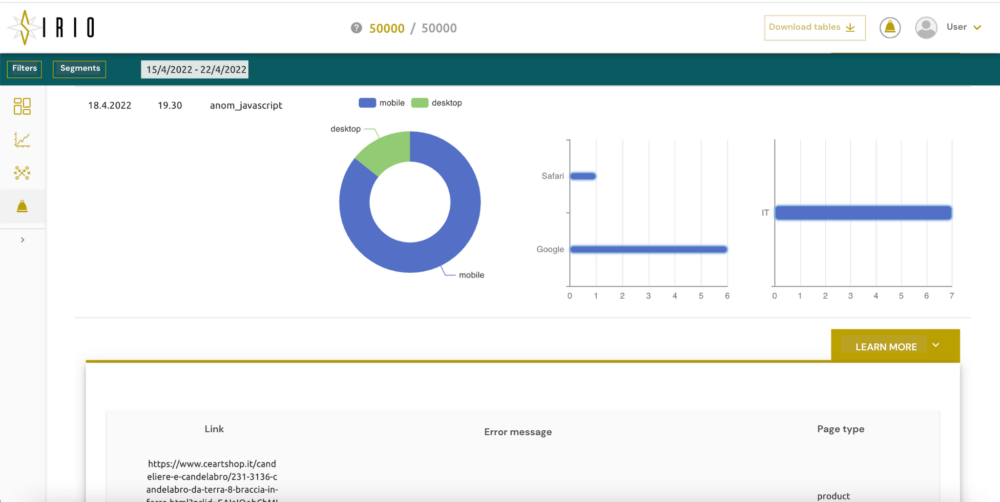
Alert
The Alerts page shows the peaks of Anomalies that occurred at certain times of the day. Shows the date and time, the type of anomaly, on which device they occurred, from which browser and the country.
DOWNSITE
This section also shows the Date, the start and end time, the IP of the server of the site’s Downsite.